
Assessing portfolio performance is crucial for investors to understand how their investments are doing and make informed decisions. While Return on Investment (ROI) is a widely used metric, it doesn’t tell the whole story. Advanced performance indicators provide a more in-depth analysis, considering factors like risk, volatility, and consistency. This article will explore some of these advanced indicators, helping you gain a deeper understanding of your portfolio’s performance.
Advanced Portfolio Performance Indicators:
1. Sharpe Ratio
The Sharpe Ratio measures risk-adjusted return, meaning it evaluates how much return you receive for the risk you take. It’s calculated by subtracting the risk-free rate (e.g., the return on a government bond) from the portfolio’s return and dividing it by the portfolio’s standard deviation. A higher Sharpe Ratio indicates better risk-adjusted performance.
2. Sortino Ratio
Similar to the Sharpe Ratio, the Sortino Ratio also measures risk-adjusted return. However, it focuses only on downside risk, considering the standard deviation of negative returns. This is useful for investors who are more concerned about potential losses than overall volatility.

3. Treynor Ratio
The Treynor Ratio is another risk-adjusted return metric, but it uses beta as the risk measure. Beta measures the portfolio’s volatility relative to the market. A higher Treynor Ratio indicates better performance relative to the market risk taken.
4. Alpha
Alpha measures the portfolio’s excess return compared to its benchmark. It shows how much the portfolio outperformed or underperformed the market, adjusted for risk. A positive alpha indicates that the portfolio manager has generated returns above what would be expected based on the portfolio’s risk level.
5. Beta
Beta, as mentioned earlier, measures the portfolio’s volatility relative to the market. A beta of 1 means the portfolio’s price will move in the same direction as the market, while a beta of 2 means it will move twice as much. Beta helps investors understand the portfolio’s risk level compared to the overall market.
6. Information Ratio
The Information Ratio measures the portfolio manager’s skill in generating excess returns relative to a benchmark, while also considering the consistency of those returns. A higher Information Ratio indicates better and more consistent performance.
7. Tracking Error
Tracking Error measures how closely the portfolio’s returns track its benchmark. A lower tracking error means the portfolio’s performance is more closely aligned with the benchmark. This is important for investors who want to replicate a specific index or market segment.
8. Drawdown
Drawdown measures the peak-to-trough decline in the portfolio’s value during a specific period. It helps investors understand the potential for losses and the portfolio’s recovery ability.
9. Time-Weighted Return (TWR)
TWR measures the portfolio’s performance over time, accounting for cash flows in and out of the portfolio. It’s a more accurate measure of the portfolio manager’s skill than simple return, as it eliminates the impact of investor deposits and withdrawals.
10. Money-Weighted Return (MWR)
MWR, also known as the Internal Rate of Return (IRR), calculates the portfolio’s return based on the timing and size of cash flows. It’s useful for investors who want to understand the impact of their own investment decisions on the portfolio’s performance.
Reviews : Advanced Portfolio Performance Indicators
1. Morningstar
Morningstar is a leading investment research firm that provides comprehensive analysis and ratings for mutual funds, ETFs, and stocks. Their ratings consider various factors, including performance, risk, fees, and management. Morningstar also provides advanced portfolio analytics tools for investors to track and analyze their investments.
2. Seeking Alpha
Seeking Alpha is a platform for investment research and analysis, providing articles, news, and data on various investment opportunities. They also have a portfolio tracker tool that allows investors to track their performance and analyze their holdings using various metrics, including those mentioned above.
FAQ
1. Why is it important to look beyond ROI when evaluating portfolio performance?
ROI is a simple and widely understood metric, but it doesn’t consider factors like risk, volatility, and consistency. Advanced performance indicators provide a more in-depth analysis, helping investors make informed decisions based on their risk tolerance and investment goals.
2. Which performance indicator is the most important?
There is no single “most important” indicator. The best metrics to use depend on the investor’s individual needs and preferences. However, some commonly used indicators include the Sharpe Ratio, Sortino Ratio, and Alpha.
3. How can I use these indicators to improve my portfolio performance?
By understanding these indicators, you can identify areas where your portfolio may be underperforming or taking on too much risk. You can then adjust your investment strategy accordingly, diversifying your holdings, rebalancing your portfolio, or seeking professional advice.
4. Where can I find data for these indicators?
Many investment platforms and research websites provide data for these indicators. You can also calculate them yourself using spreadsheet software or specialized financial calculators.
5. Are there any limitations to these indicators?
Yes, like any metric, these indicators have limitations. They are based on historical data and may not accurately predict future performance. Additionally, some indicators may be more relevant for certain types of investments or investment strategies than others.
Conclusion
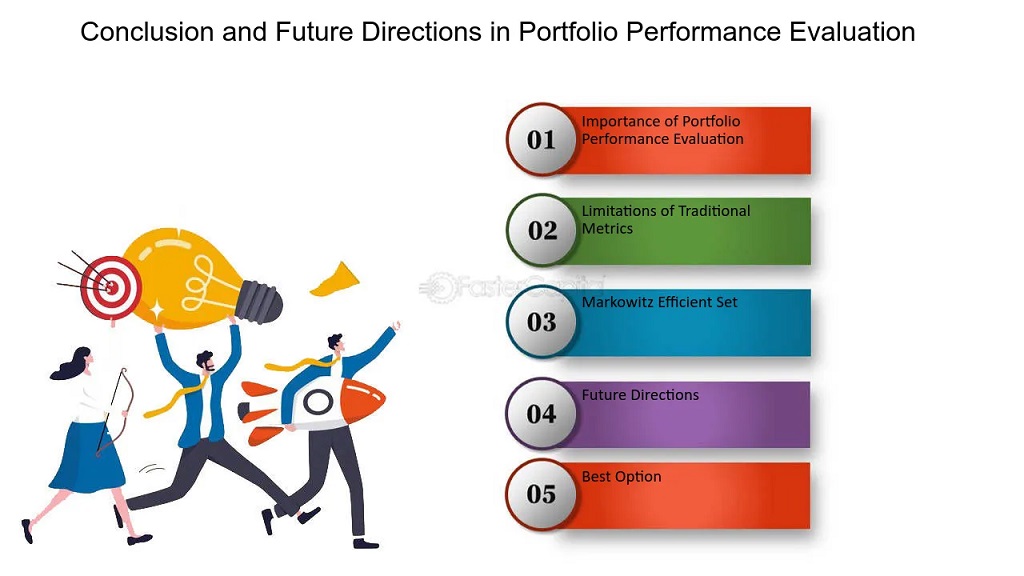
Advanced portfolio performance indicators provide a deeper understanding of your investments, going beyond simple return calculations. By considering factors like risk, volatility, and consistency, you can make more informed decisions and improve your overall investment strategy. Remember that there is no one-size-fits-all approach, and the best indicators to use will depend on your individual needs and preferences.